Analytics
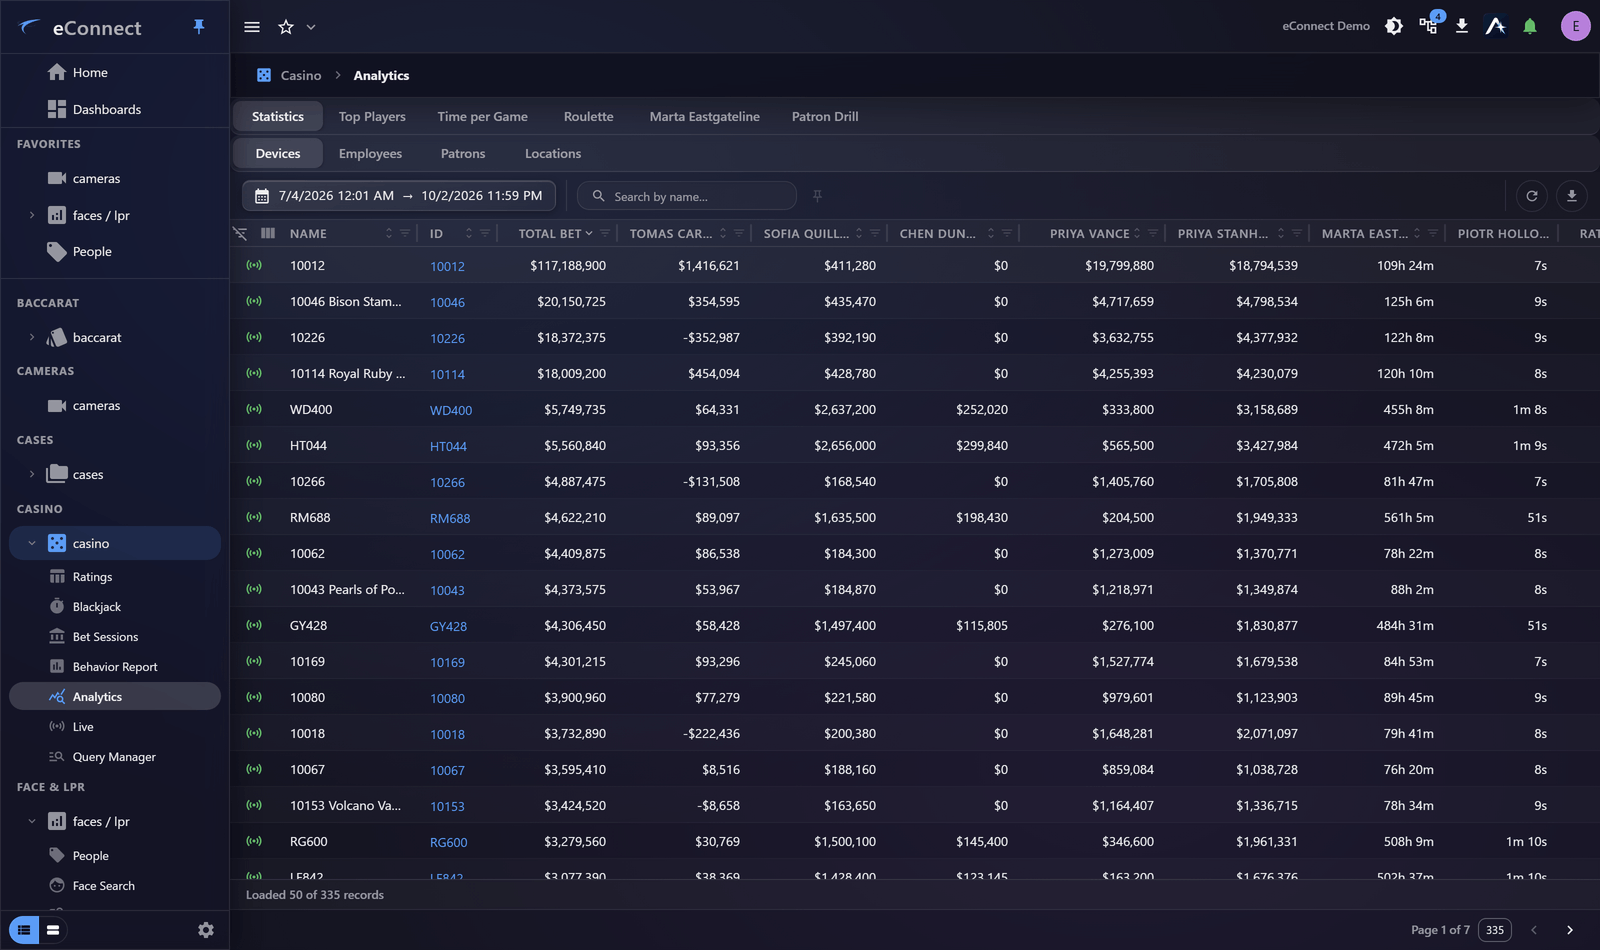
Analytics aggregates casino activity into the questions people actually ask about a floor.
What it covers
| View | Answers |
|---|---|
| Statistics | Totals and trends across tables and periods |
| Top Players | Who accounts for the most activity or value |
| Time per Game | How long games actually take |
| Roulette | Wheel outcome distribution over time |
Statistics
The general-purpose view: group by table, dealer, game type or period, and measure. It is aggregation applied to casino data, so everything you know about grouping and drilling in works here.
Read against expectation rather than in absolute terms. A table's drop means little on its own and a great deal compared with the tables beside it.
Top players
Useful for two opposite reasons: recognising the players who matter commercially, and noticing the player whose activity is unlike their own history.
The second is the one worth building a habit around. A player suddenly far above their own pattern is a more interesting signal than a player who is consistently large.
Time per game
How long games take, which drives both throughput and revenue. Compare across tables and dealers, and look for the outlier rather than the average.
Roulette
Outcome distribution over time. Over a long enough period a fair wheel produces a recognisable spread, and a wheel that does not is worth mechanical attention.
Short periods produce apparent bias on any wheel. Clusters in a few hundred spins are ordinary and mean nothing.
Only sustained deviation across a large number of spins is worth acting on — and the action is to have the wheel inspected, not to draw conclusions about play.
Drill into what stands out
Selecting a figure or a chart segment takes you to the activity behind it, then to ratings or rounds, then to the video. That path is the reason to start here rather than in a grid.
Keeping an eye on it
An analytic you check regularly belongs on a dashboard with a relative period, rather than being re-run each time.
Exporting
Analytics export as CSV or PDF. See Exporting Data.