Working With Data
Nearly everything in eConnect is the same three steps: choose what you want, look at the result, turn it into an answer. This chapter covers those steps, and the concepts they rest on, because they work the same way in every module.
The model
| Term | What it means |
|---|---|
| Module | A body of data and the views over it — Point of Sale, Faces and Plates, Casino |
| Query | A definition of which records you want |
| View | Which shape of the module's data a query runs against |
| Grid | The result, as rows |
| Aggregation | Rows turned into totals, counts and averages |
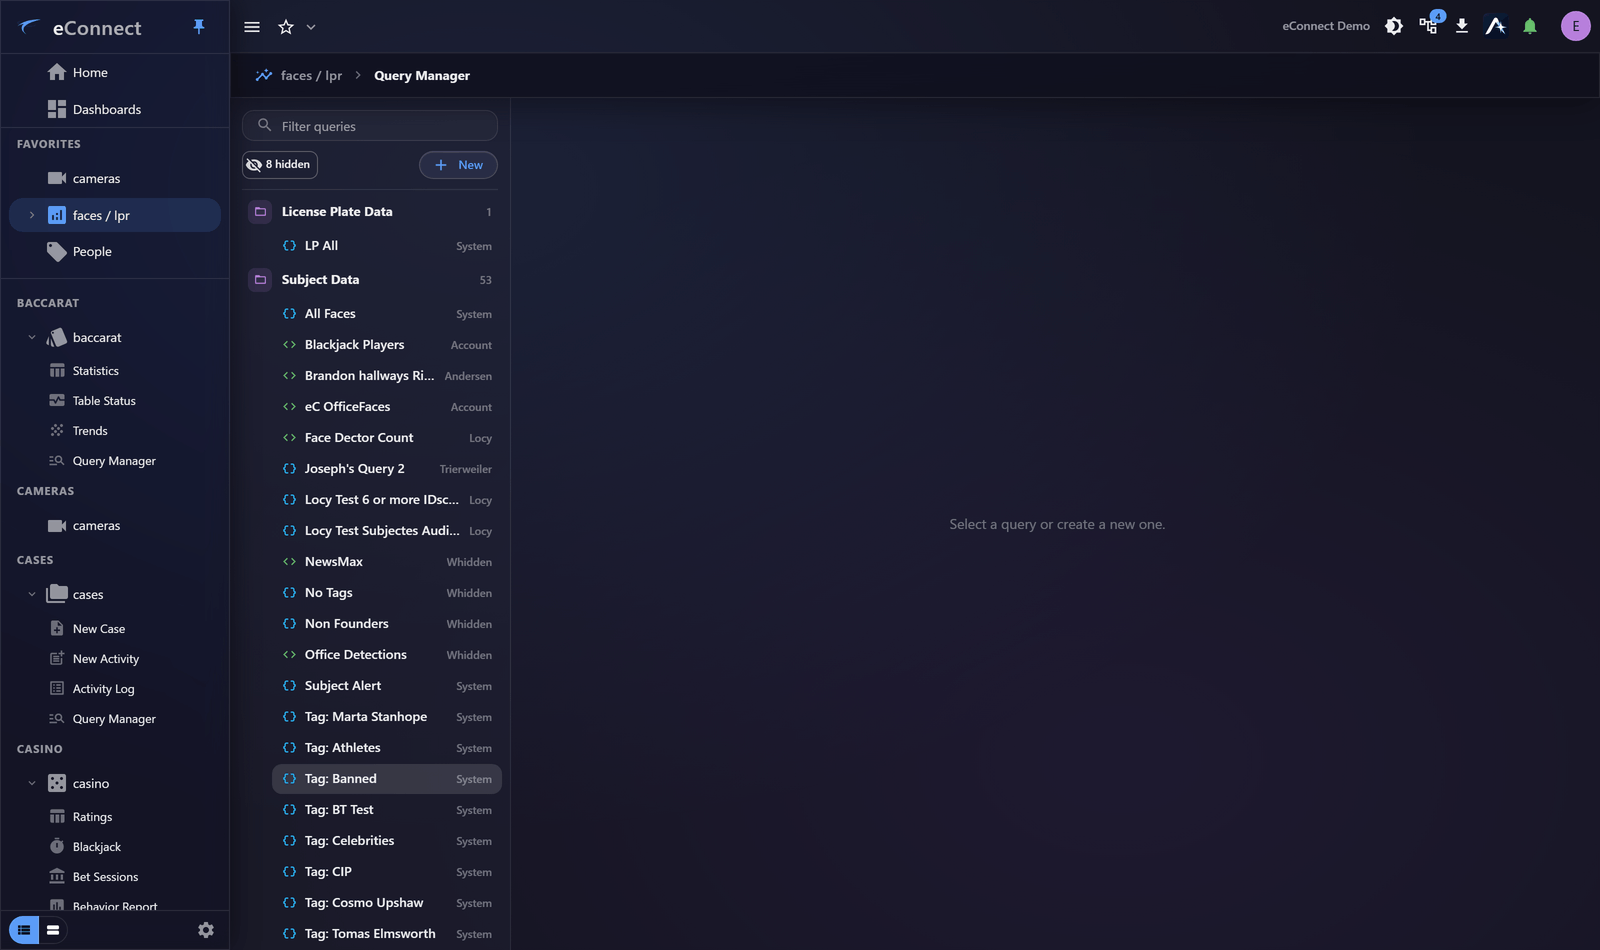
A saved query is a named, reusable definition. Once saved it can be run again, shared, used by a dashboard widget, or read by the Ace.
Two ways to build a query
Every module offers both, and you can start with one and move to the other.
| Simple | Advanced | |
|---|---|---|
| Built from | Filter rows | Condition groups with and/or |
| Good for | Most everyday questions | Nested logic and exclusions |
| Learning curve | None | Some |
Start simple. Most questions are a handful of filters and a date range, and the advanced builder exists for the ones that are not.
The usual sequence
- Set a date range. Almost every question has a period. See Date and Time Ranges.
- Filter. Narrow to the records you care about.
- Read the grid. Sort, hide columns, page through. See Reading the Results Grid.
- Aggregate. Group and measure to turn rows into an answer. See Aggregation.
- Drill back down. Click a chart slice to see the rows behind it.
- Keep it. Save the query, or export the result.
Step 5 is the one people underuse. Going from a total to the records that produced it, in one click, is the single most useful movement in eConnect.
Queries are per module, but portable
A query belongs to the module it was built in, because the fields differ. When the same shape of question applies elsewhere, Copy to Module… carries it across rather than making you rebuild it. See Copying a Query to Another Module.
What is recorded
Running and saving queries is audited, which is what makes the Usage Statistics module able to report on how eConnect is actually used.
In this chapter
- The Simple Query Builder · The Advanced Query Builder · Subqueries and Existence Tests
- The Query Manager · Copying a Query
- Reading the Results Grid · Columns, Sorting and Filtering · Exporting Data
- Aggregation · Aggregation Charts and Drill-Down
- Date and Time Ranges
Audit record
What eConnect writes to the audit trail for the actions on this page.
QUERY 'POS Events' FROM {start date} TO {end date}; VIEW: 'Events' PAGE {page};