Statistics
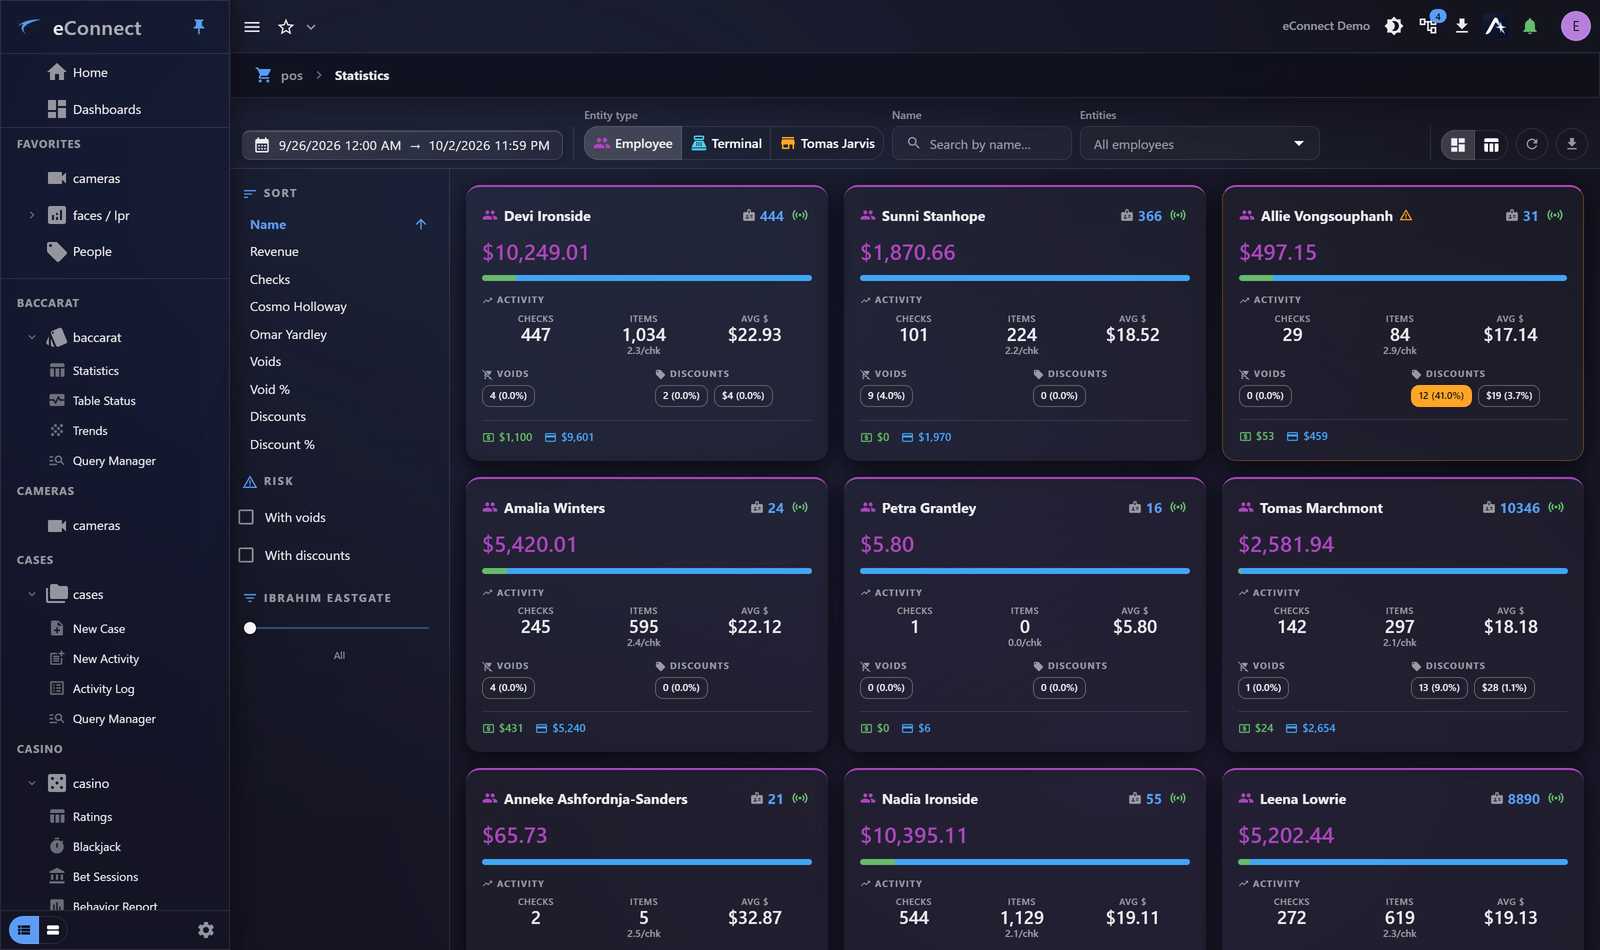
Statistics turns transactions into totals — by employee, register, revenue centre and period.
What it answers
The questions a grid cannot: how much, how many, which is highest, and how does this period compare with the last.
It is the same machinery as aggregation applied to point-of-sale data, so everything you know about grouping and measuring works here.
Reading against expectation
Absolute figures are rarely the finding. What matters is a value unlike its peers.
| Compare | Reveals |
|---|---|
| Employee against employee | Practice that differs from colleagues |
| Register against register | A location or a device behaving differently |
| This week against last | A change in behaviour |
| Shift against shift | Patterns tied to time rather than person |
A void rate means nothing on its own. A void rate three times everyone else's on the same shift means a great deal.
Normalise before concluding
The commonest analytical mistake here.
An employee with more voids may simply have served more customers. Before treating a total as an exception, look at it as a rate — voids per transaction, discount value as a share of sales. Averages and ratios are available as measures precisely for this.
An employee whose absolute numbers stand out but whose rates are ordinary is busy, not suspicious.
Drill into what stands out
Selecting a figure or a chart segment takes you to the transactions behind it — filtered to that group, with your query still applied. From there, the receipt, and from there the video.
That path, from a total to the footage in three clicks, is the reason to start here rather than in the events grid.
Narrowing to the entities you care about
Statistics can be restricted to a picked set of entities — these four registers, that revenue centre — rather than everything the module holds. On a property with two hundred terminals, that is the difference between a readable comparison and a wall of rows.
Pick the set deliberately: a comparison across the registers of one outlet means something, and a comparison across every register on the estate usually does not.
Comparing employees properly
For systematic comparison of employees against their peers, the Behaviour Report is purpose-built and does the normalising for you.
Exporting
Export all statistics produces the totals as CSV — the figures as displayed, not the underlying rows. For the transactions, drill in and export from there. See Exporting Data.
Keeping an eye on it
A statistic you check regularly belongs on a dashboard rather than being re-run. Use a relative period so it keeps meaning "recently".
Audit record
What eConnect writes to the audit trail for the actions on this page.
QUERY EXPORT '{name}' FROM {start date} to {end date}