Statistics
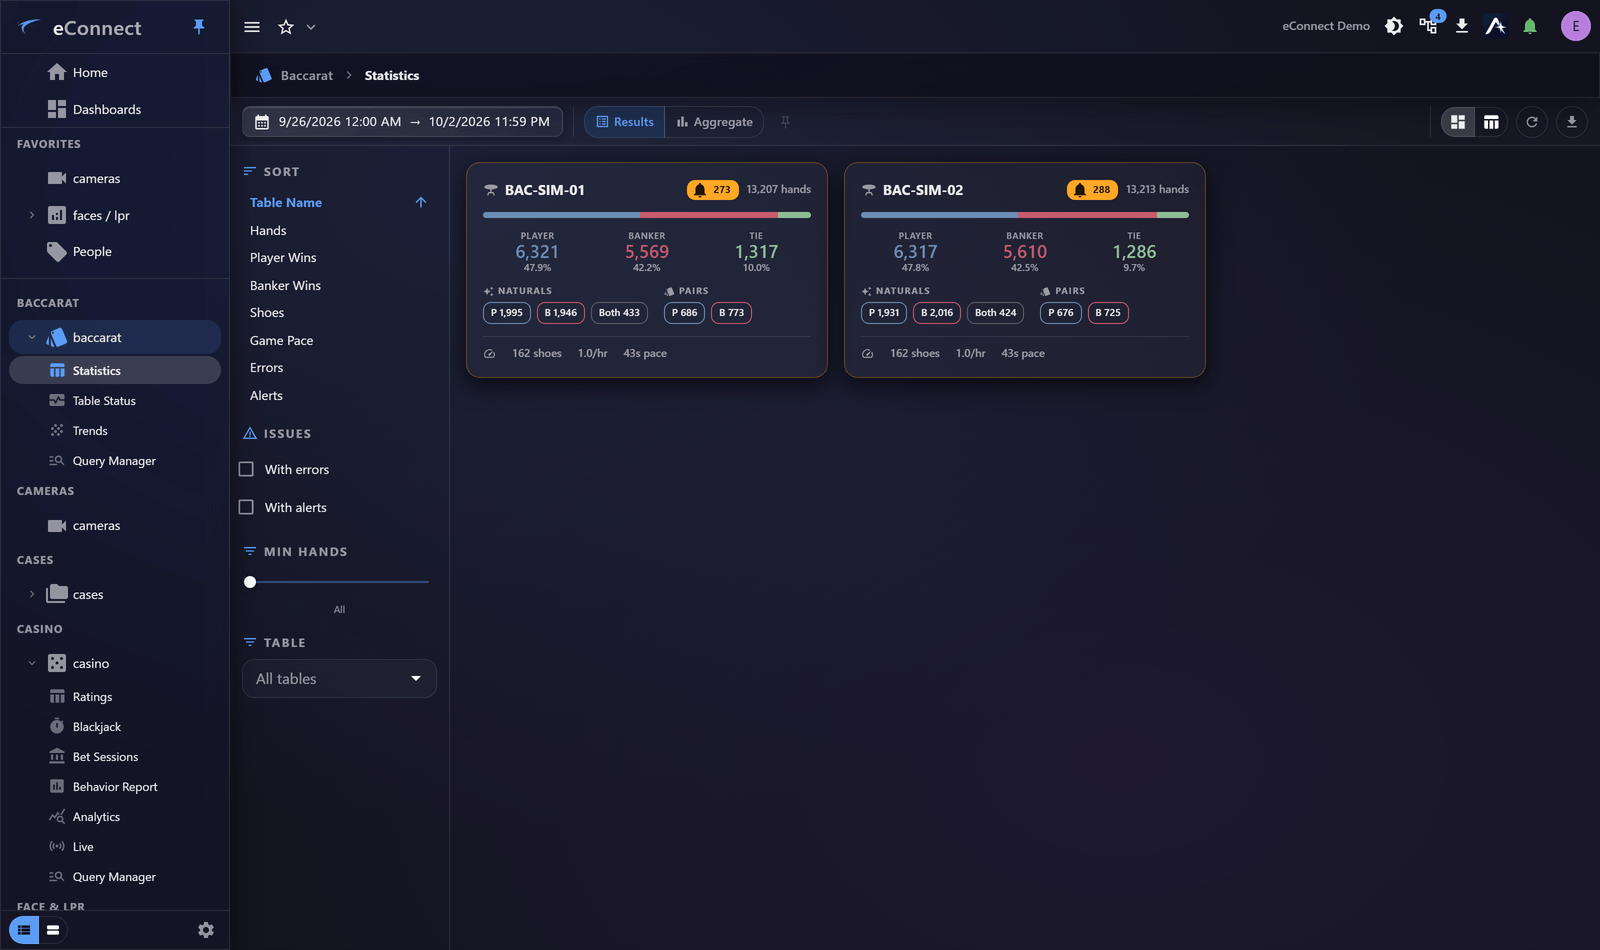
Statistics turn baccarat activity into table performance: how much was played, how it went, and how one table compares with another.
What it covers
Outcomes and their frequencies — banker and player wins, ties, naturals, pairs — with the averages and commissions arising, grouped by table and period.
Where Trends and Roads answer "how is this shoe running?", this answers "how is this table performing?"
Reading it
Compare rather than read absolutes. A table's figures mean something next to the other tables and next to the same table last month; on their own they are just numbers.
The useful reading is the outlier — the table unlike its neighbours, or unlike itself.
Outcome frequencies vary substantially over short periods. A table showing an unusual split over one evening is ordinary and means nothing.
Only sustained deviation over a large number of hands is worth investigating, and the first explanation to rule out is a procedural one rather than anything else.
Average bet and commissions
Average bet drives most derived figures, so check the period and volume it was calculated over before relying on it. Commissions follow from outcomes and are worth reconciling against your own accounting rather than taken as authoritative on their own.
Drilling in
Selecting a figure takes you to the activity behind it, and from there to the video of the play. That path — from a statistic to the recording — is what makes this more than a report.
This action is recorded in the audit trail.
Keeping an eye on it
A figure you check regularly belongs on a dashboard with a relative period, rather than being re-run each time.
Exporting
Statistics export as CSV. See Exporting Data.
Audit record
What eConnect writes to the audit trail for the actions on this page.
CAMERA '{camera name}' PLAYBACK @ '{local start time}'