Adding and Arranging Widgets
Widgets are added from the dashboard's own controls, placed on a grid, and configured individually.
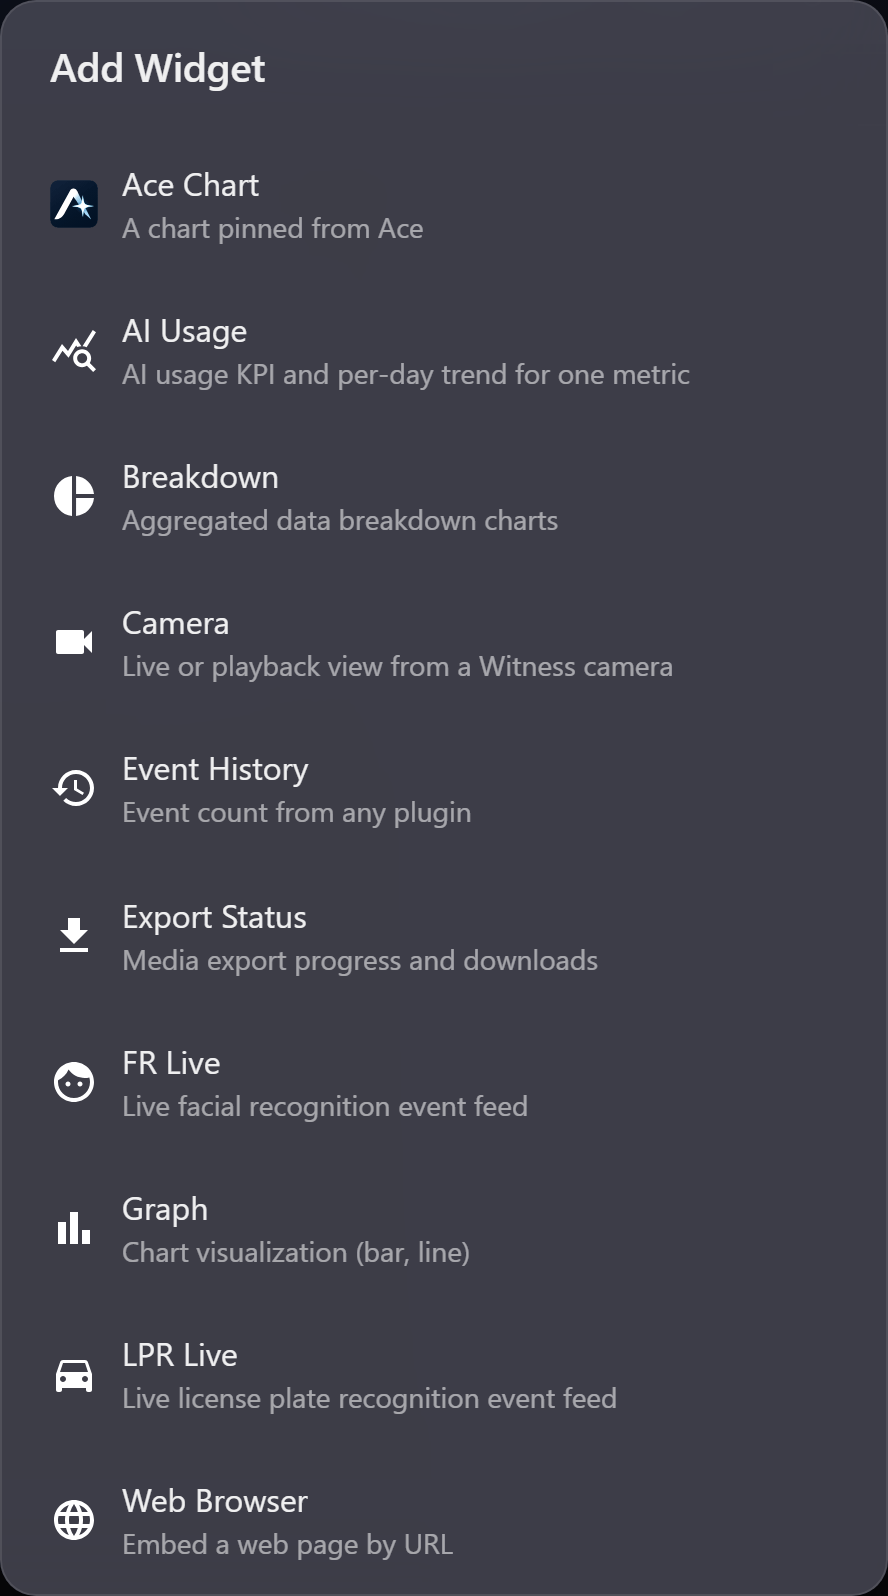
Adding one
Choose the widget type, place it, then configure it. Most data widgets ask for a saved query and how to display it; camera widgets ask which camera.
Each widget has a name of its own, shown in its header. Name it for what it answers — "Voids by register" — rather than leaving the default, because the header is the only label a reader gets.
Available widgets
| Widget | Purpose |
|---|---|
| Graph | A saved query charted |
| Event History | Recent events, live |
| Breakdown | Proportions across a field |
| Camera | Live or playback video |
| Export Status | Media exports and downloads |
| FR Live / LPR Live | Face and plate detections as they happen |
| Ace Chart | A chart pinned from the assistant |
| AI Usage | One AI usage metric |
| Web Browser | An external web page embedded in the dashboard |
The Web Browser widget is useful for putting an intranet page, a supplier's status page or another system's display alongside eConnect's own data.
Which widgets you see depends on your licensed modules and permissions.
Arranging
Drag to move, drag an edge to resize. Widgets snap to the grid so a tidy layout stays tidy.
Two rules that make a dashboard readable:
- Size by importance. The thing you look at first should be the biggest, top left.
- Group by subject. Related widgets adjacent; unrelated ones separated by space.
A widget too small to read is worse than absent, because it takes up room and gives nothing. If something will not fit legibly, it belongs on a different dashboard.
Sizing for the screen it will live on
Design at the size it will be used. A dashboard built on a desktop and shown on a wall three metres away is unreadable, and the fix is fewer, larger widgets rather than a different arrangement.
Reconfiguring and removing
Each widget's own menu carries its configuration and removal. Removing a widget does not affect the saved query behind it — the query stays, and other widgets and dashboards using it are unaffected.
Changes save themselves. Drag a widget, resize it, rename it or change its settings and the dashboard is written shortly afterwards — leaving the page no longer loses the arrangement you just made. On a dashboard you share with other people, that is worth remembering before you drag something to see what it would look like.
Refresh
Data widgets refresh themselves, so a dashboard left open stays current without intervention. Live widgets update as events arrive.
The dashboard toolbar carries the controls for that, as one segmented strip:
| Control | What it does |
|---|---|
| Live | Turns automatic refreshing on or off for the whole dashboard |
| Range | The rolling period the widgets cover while live |
| Frequency | How often they refresh |
| The refresh button | Refreshes now, and says when the data was last queried |
Turn Live off on a dashboard you are reading carefully — figures that move while you are comparing them are worse than figures that are a few minutes old — and back on for a wall display, where being current is the whole point. The last-queried time is the thing to check before quoting a number from a screen that has been open all day.
Where the widget can take you
Widgets are not just displays. Many are clickable — an Event History row opens the event, a Breakdown segment opens the records behind it. Those drills are captured in your Workspace like any other.
Audit record
What eConnect writes to the audit trail for the actions on this page.
DASHBOARD CONFIGURE WIDGET '{name}' SAVEDDASHBOARD CONFIGURE '{dashboard name}' REMOVED WIDGET '{name}'