AI Usage and Analytics
Settings ▸ System Administration ▸ Ace ▸ AI Usage answers two questions: what the assistant is costing you, and whether it is working well. It is the page to open before changing anything in AI Configuration, so adjustments respond to measurements rather than impressions.
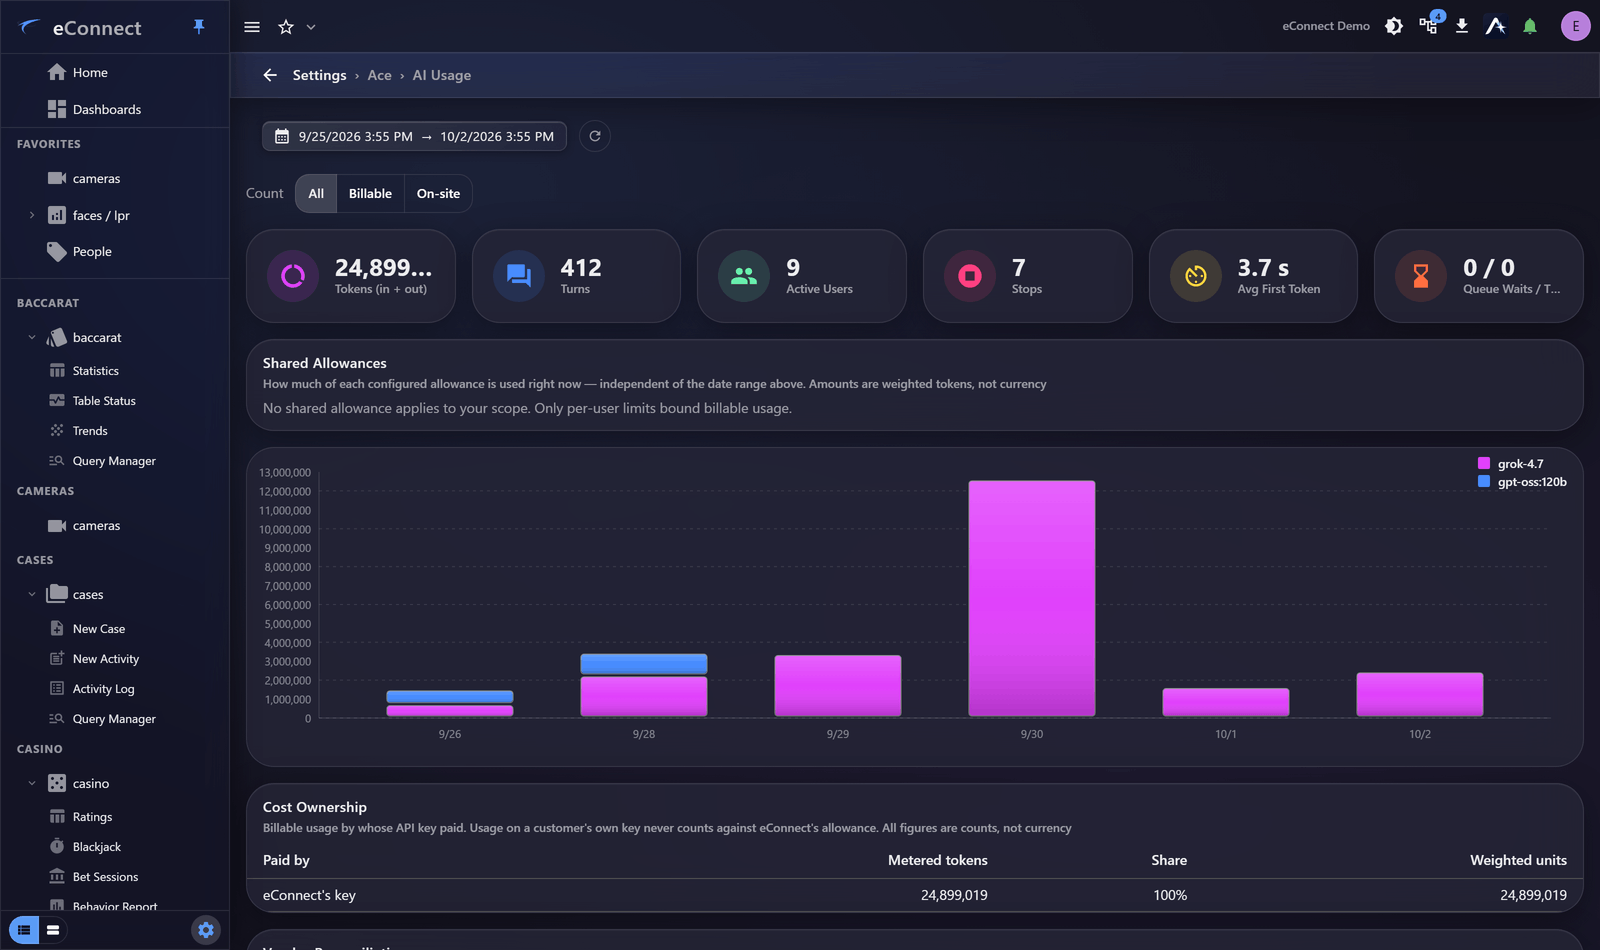
This page is available to holders of AI Usage → View, as well as to anyone who can manage providers.
Choosing what to count
Above the figures, All / Billable / On-site decides which usage is being reported.
That distinction is the one to get right before reading anything else. On-site usage runs on your own hardware and costs you nothing per token; Billable is what counts against an allowance. A figure that looks alarming under All is often almost entirely on-site.
The date range beside it applies to everything on the page except Shared Allowances.
The headline figures
| Metric | What it tells you |
|---|---|
| Tokens (in + out) | Total consumption, counting both questions and answers |
| Turns | How many questions were asked and answered |
| Active Users | How many people actually used the assistant in the period |
| Stops | Answers a user cancelled part-way through |
| Avg First Token | How long people waited before an answer started appearing |
| Queue Waits / Timeouts | Requests that waited for capacity, and those that gave up |
Read them together rather than individually. High Turns with low Active Users means a small group is relying on the assistant heavily — useful to know before you set per-user limits that would disrupt them. High Tokens with flat Turns means conversations are getting longer, since earlier turns are re-sent as context on each question.
Avg First Token is the number users actually experience as "is this thing working?". When it climbs, check Queue Waits next: waits rising alongside it points at capacity, and the setting to look at is Max concurrent streams, or adding a provider to the pool.
Stops deserve attention when they rise. People cancel answers that are too slow or visibly going the wrong way, so a climbing stop count usually means either a performance problem or questions the assistant is handling badly.
Shared Allowances
How much of each configured allowance is used right now, independent of the date range above. Amounts are weighted tokens rather than currency.
Where no shared allowance applies to your scope, the page says so plainly and notes that only per-user limits bound billable usage — which is worth knowing before you go looking for a cap that was never set. Allowances themselves are configured in AI Configuration.
Usage by model
The chart breaks consumption down per day and per model, stacked so you can see which models the work actually went to.
That matters because models differ enormously in cost and speed. A day dominated by a large hosted model looks very different on a bill from the same number of tokens served by a local one, and this chart is where that becomes visible.
Cost Ownership
Billable usage by whose API key paid for it. Usage on a customer's own key never counts against eConnect's allowance, and the table reports metered tokens, share and weighted units — all counts rather than currency.
This is the section to read when reconciling what you are billed against what was used, and it is the one that answers "is this our consumption or theirs?"
Tool health
Beneath the headline figures is a breakdown per tool — the individual capabilities the assistant uses to read your data, such as fetching point-of-sale events or searching subjects.
| Column | Meaning |
|---|---|
| Tool | The capability being measured |
| Calls | How often it was used |
| Errors | How often it failed |
| Error % | Failures as a share of calls |
| Avg Duration | How long it typically takes |
This table is the fastest route from "the assistant gave a poor answer" to a cause. A tool with a high Error % is failing to retrieve data, so answers that depend on it will be thin or wrong — and that is a data or permissions problem, not a model problem. A tool with a high Avg Duration is where the wait is coming from.
The failure detail can be exported for a fuller look at what went wrong, which is worth doing before raising a support case.
Reading one conversation's traffic
The figures on this page say how much and how well. When you need to know what was actually sent, the AI wire transcript beside the token totals in a chat shows the exact request and response for that conversation — the tool manifest, the questions, the answers and the tool results.
It is available to holders of AI Providers → Manage, the same key that opens AI Configuration, and to nobody else: a transcript is the content of somebody's conversation, so it is bounded by the key that already governs the assistant's configuration.
Entries are long — the first is routinely tens of thousands of characters — so each collapses to a short preview with Show all behind it, and Copy all puts the whole exchange on the clipboard for a support case. Token counts on the same line are abbreviated, with the exact figure on hover.
Reach for this when the usage figures and the tool health table agree that something is wrong but not on what: the transcript is where a malformed tool result or a truncated manifest becomes visible.
Using this page to control cost
The practical loop is:
- Read Tokens (in + out) against the allowance you set in AI Configuration.
- If consumption is concentrated in a few people, set or tighten per-user limits rather than lowering the shared allowance, which would penalise everyone.
- If consumption is broad and growing, the allowance itself is the lever, and Warn at (%) should be set where it gives you notice in time to act.
- Re-check after a week. Limits that are too tight surface here as stops and complaints rather than as savings.
Watching for trouble
The signals worth acting on, in the order they usually appear:
- Queue waits climbing — capacity is short; add a provider to the pool or raise concurrent streams.
- Timeouts appearing — capacity is short enough that requests are being abandoned.
- One tool with a rising error rate — investigate that tool's data source rather than the assistant.
- Tokens rising without more turns — conversations are getting longer; nothing is broken, but cost will follow.
Related
- AI Configuration — providers, models, allowances and limits
- What Ace Can and Cannot See — the permission model behind every answer
- Reading the Audit Trail — assistant activity in the audit record